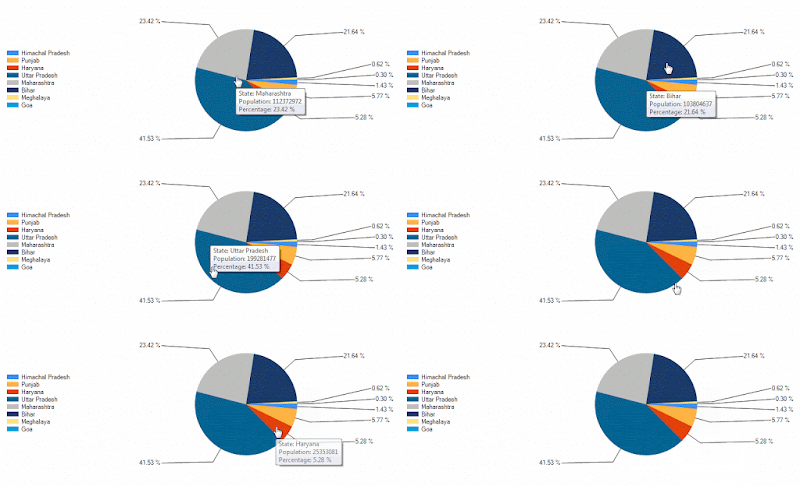
In
this article I am going to explain how to create pie chart in asp.net using
chart control.
In
the previous article I have explained how to implement Sorting, Filter andPagination with Angular UI-Grid in MVC application, how to implement paginationand sorting with Angular UI Grid in MVC application and how to Display datawith Angular UI grid in MVC application.
Description:
I
want to create a pie chart to show the state wise population in percentage. I am
using asp.net chart control to create pie chart.
Implementation:
I
have created table Tb_Population and insert some dummy records.
Add
a webform to project. Drag and drop the chart control from toolbox to webform.
HTML Markup:
<html xmlns="http://www.w3.org/1999/xhtml">
<head runat="server">
<title></title>
</head>
<body>
<form id="form1" runat="server">
<div>
<asp:Chart ID="Chart1" runat="server" Width="800px">
<Legends>
<asp:Legend Alignment="Center" Docking="Left" IsTextAutoFit="true" Name="StateName" LegendStyle="Table"/>
</Legends>
<Series>
<asp:Series Name="Series1" ChartType="Pie"
CustomProperties="PieLineColor=Black, PieLabelStyle=Outside">
</asp:Series>
</Series>
<ChartAreas>
<asp:ChartArea Name="ChartArea1">
<Area3DStyle Enable3D="True" Inclination="0" Rotation="0" />
</asp:ChartArea>
</ChartAreas>
</asp:Chart>
</div>
</form>
</body>
</html>
Import the
namespace:
C#
Code:
using
System.Configuration;
using
System.Data.SqlClient;
using
System.Data;
using
System.Web.UI.DataVisualization.Charting;
VB.net
Code:
Imports
System.Data
Imports
System.Data.SqlClient
Imports
System.Configuration
Imports
System.Web.UI.DataVisualization.Charting
Create
a method to retrieve data from database and show in Chart control.
C#
Code
SqlConnection
con = new SqlConnection(ConfigurationManager.ConnectionStrings["connection"].ToString());
protected void Page_Load(object
sender, EventArgs e)
{
if
(!IsPostBack)
{
BindChart();
}
}
public void BindChart()
{
try
{
SqlDataAdapter
adp = new SqlDataAdapter("Select StateName,TotalPopulation from
Tb_Population", con);
DataTable
dt = new DataTable();
adp.Fill(dt);
string[] x = new string[dt.Rows.Count];
int[]
y = new int[dt.Rows.Count];
for
(int i = 0; i < dt.Rows.Count; i++)
{
x[i] =
dt.Rows[i][0].ToString();
y[i] = Convert.ToInt32(dt.Rows[i][1]);
}
foreach
(Series s in
Chart1.Series)
{
s.ToolTip = "State: #VALX\nPopulation: #VALY\nPercentage:
#PERCENT";
}
Chart1.Series[0].Points.DataBindXY(x, y);
Chart1.Series[0].Label = "#PERCENT";
Chart1.Series[0].LegendText = "#AXISLABEL";
}
catch (Exception ex)
{
}
}
VB.net
Code:
Private con As New SqlConnection(ConfigurationManager.ConnectionStrings("connection").ToString())
Protected Sub Page_Load(ByVal
sender As Object,
ByVal e As
System.EventArgs) Handles
Me.Load
If Not IsPostBack Then
BindChart()
End If
End Sub
Public Sub BindChart()
Try
Dim
adp As New SqlDataAdapter("Select
StateName,TotalPopulation from Tb_Population", con)
Dim
dt As New DataTable()
adp.Fill(dt)
Dim
x As String() =
New String(dt.Rows.Count
- 1) {}
Dim
y As Integer()
= New Integer(dt.Rows.Count
- 1) {}
For
i As Integer =
0 To dt.Rows.Count - 1
x(i) = dt.Rows(i)(0).ToString()
y(i) = Convert.ToInt32(dt.Rows(i)(1))
Next
For
Each s As Series In
Chart1.Series
s.ToolTip = "State: #VALX" & vbLf & "Population: #VALY" & vbLf & "Percentage: #PERCENT"
Next
Chart1.Series(0).Points.DataBindXY(x, y)
Chart1.Series(0).Label = "#PERCENT"
Chart1.Series(0).LegendText = "#AXISLABEL"
Catch
ex As Exception
End Try
End Sub
Build
the application and run.


.png)

How to find chart control from Toolbox ?
ReplyDeleteBecause i dont have any such tool .
On which framework you are working? Chart control is not a standard feature control of .NET 3.5, later version already has chart control.
Delete